Reports
Details: Reports
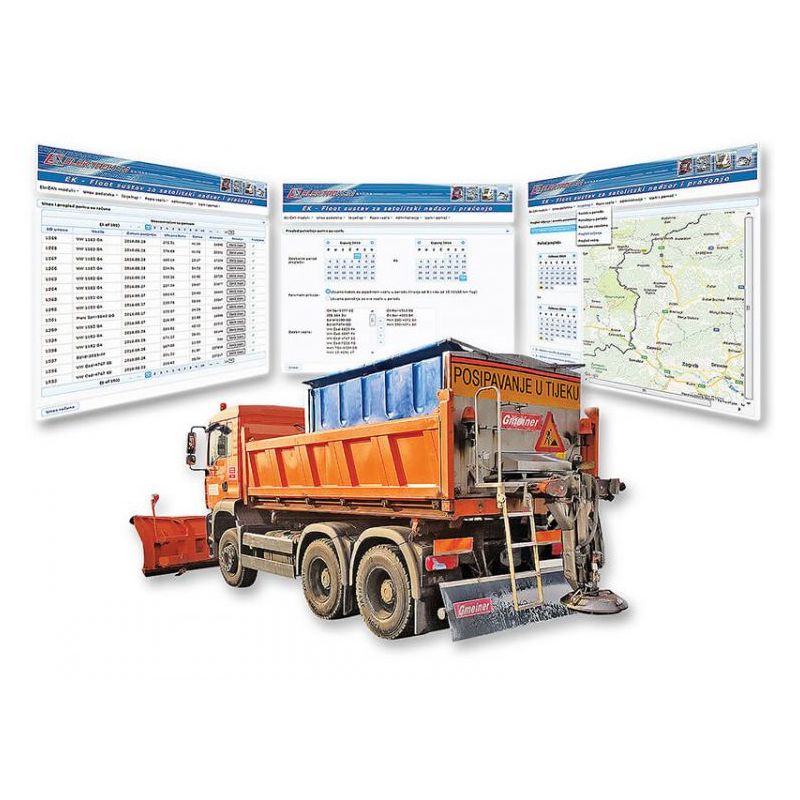
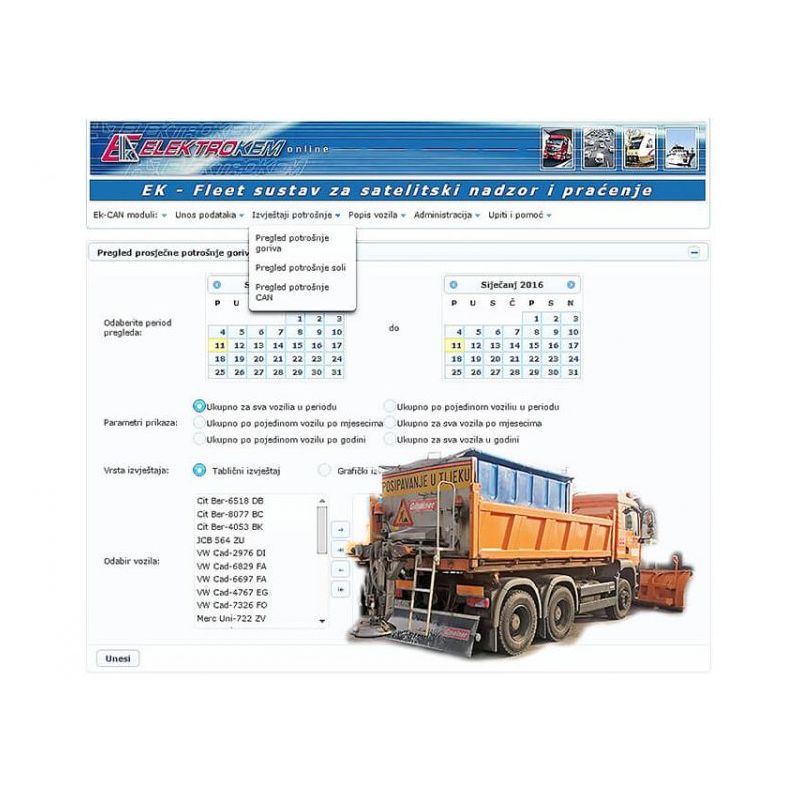
The database generates a few types of reports which depend on the number of parameters measured by a sensor in key places of the vehicle. The reports can be displayed as a text, a table or a graph and can, according to user's wishes, be generated for a particular period, for one or more vehicles or drivers.
The reports are a part of a system which is subject to change. Using new parameters, new reports are generated which may not resemble the existing (in appereance and presentation), but which are basically very similar. All reports and graphs displayed can be printed and filed.
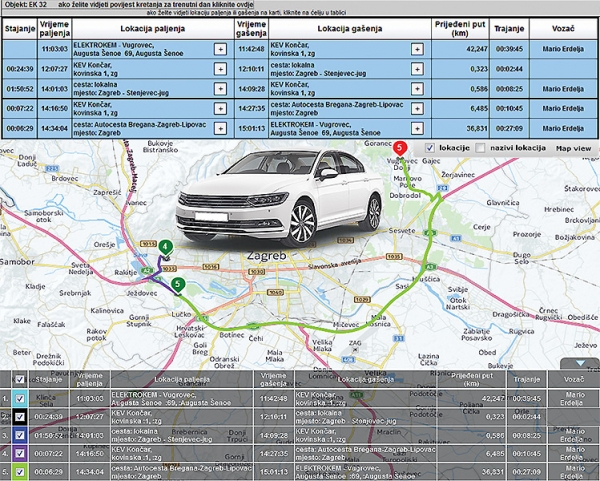
1. Vehicle movement history
The database generates a report (a table) which clearly indicates the time of starting and turning off the vehicle, the location of starting and turning off the vehicle, kilometers travelled, journey duration and the name of the driver.
Vehicle location is shown by descriptively positioning the vehicle in relation to the nearest town or street. If the user wishes, a map display can be generated by a simple click on the location text.

2.Tank fuel level measurement
Constant tank fuel level measurement enables defining:
- exact date and time of fuel filling
- location of fuel filling (gas station)
- amount of fuel tanked which enables fuel consumption receipt’s monitoring and additional travel warrant issuing automated.
The graph shows fuel level change.
The changes marked with a red vertical line, under which are exact time and location information, are the points of sudden fuel level changes. By clicking the time/location text under the red line, a window with a detailed fuel filling location is displayed.

3. A graph display of stops during the journey
Stopping is in this system defined as time which exceeds 5 minutes during which the object does not move more than 100 meters. In this way, time spent stopping for traffic signalization is excluded.
4. Parallel display of kilometeres travelled and time spent
The report adds the time of the engine running and kilometers travelled for a particular period and a particular vehicle. In this way it is easy to check a vehicle's usability and encumbrance.
5. Speed and engine revolution graph
The graph shows the value curve of object speed alongside the engine revolution curve.
The analysis of these two curves can precisely determine the time and place of engine overload or speeding and can possibly warn the driver.

6. Temperature movement graph
The data obtained from the sensor are presented in the form of a graph, in which the curve represents the engine temperature values in degrees Celsius or cargo space, depending on where the sensor is fitted.
Category
EK Fleet system for satellite monitoring and vehicle surveillance, System features
View similar products
EK Systems - All


